Reported violent crime rate in New York before 1990
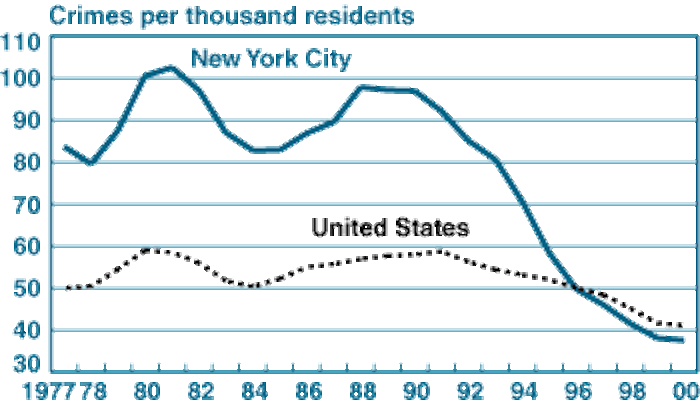
This graph shows us the stistic of crimes per 1000 residents in New York city from 1977 till 2000. It is obvious that the periods with the highest rates of immigration: 1980-1981 and
1989-1990 have more crimes. The economic problems, crises, high taxes, laws against non-professional immigrants influenced on it.

During 1996, 8,759 bias-motivated criminal incidents were reported to the FBI by 11,354 law enforcement agencies in 49states and the District of Columbia. Of the 8,759 incidents, 5,396 were motivated by racial bias; 1,401 by religious bias; 1,016 by sexual-orientation bias; 940 by ethnicity/ national origin bias; and 6 by multiple biases.
Twelve persons were murdered in 1996 in incidents motivated by hate. Racial bias motivated the highest number of these known offenders, 66 percent were white and 20 percent were black. Bias against Hispanics served as the motivation for 2 of the 12 homicides, while sexual-orientation bias motivated the remaining 2.
In 1996, the majority of hate crime occurred in/on residential properties. Following closely were incidents perpetrated on highways/roads/alleys/streets, accounting for 21 percent, while 9 percent occurred at schools/colleges.
The remaining incidents were widely distributed among various locations.


Комментарии
Отправить комментарий